All data → one dataset → analysis → forecast → validation targets

Methodology

How Cratona turns a territory's scattered geodata into a verifiable forecast and a short list of targets.

An ensemble, not a single model

We compare seven architectures — from Random Forest to convolutional networks with FiLM geochemistry fusion — and work as an ensemble. Convolutional models see the texture and arrangement of features, not just their averages, and transfer better to new territories.

ModelArchitectureInputGeochemistryUncertainty
M0aRandom Forest (500 trees)108 = 54 ch × (mean + std)nonetree std
M0bRandom Forest (500 trees)128 = 108 + 15 geochemconcatenationtree std
M1aFCNN 108→128→64→1108noneMC-Dropout ×20
M1bFCNN 128→128→64→1108 + 15 geochemconcatenationMC-Dropout ×20
M2aCNN, 54 channels64×64×54noneMC-Dropout ×20
M2bCNN, 54 channels64×64×54concatenationMC-Dropout ×20
M2cCNN + FiLM64×64×54FiLMMC-Dropout ×20

MC-Dropout — uncertainty estimation

The model runs the prediction 20 times with a random part of the network switched off. If the results repeat, the forecast is considered stable. If the estimates differ noticeably, the area is flagged as a zone of elevated uncertainty.
LORO-CV — testing on new territories

The model is trained on some regions and tested on others that were not used in training. This shows how robustly it performs beyond the source data and how well the learned patterns transfer to new areas.

Class separation

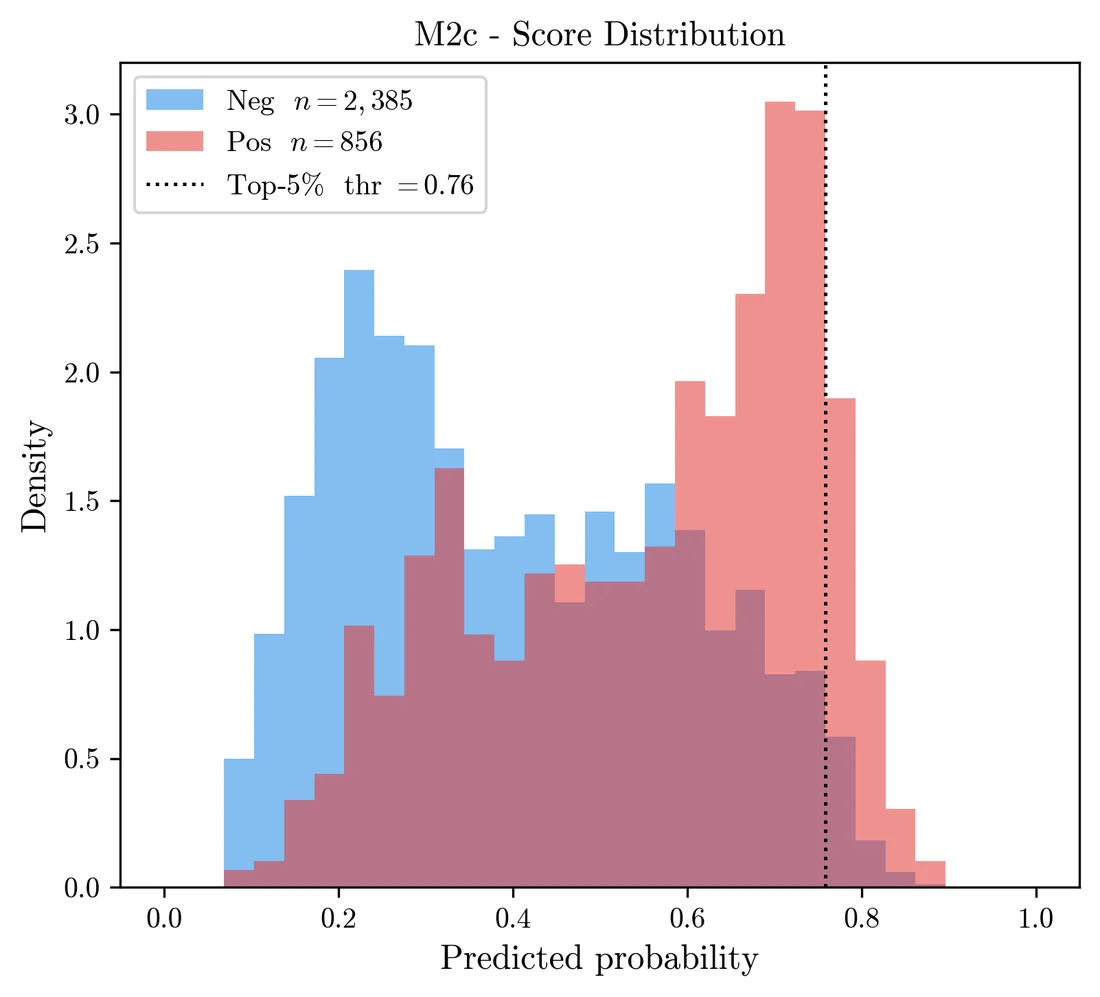
The ConvNeXt architecture with geochemical features integrated via the FiLM mechanism showed the best separation of ore-bearing and background areas among the tested models. The score distributions of the two classes overlap less, so the model ranks the territory by prospectivity more robustly. Confidence is assessed separately, from prediction stability and the uncertainty level.

Histogram of predicted scores for ore-bearing vs background patches with the top-5% threshold
M2c (ConvNeXt + FiLM): score distribution. Clear class separation.

AUC-ROC by model (LORO-CV)

AUC-ROC shows how well the model ranks the territory by prospectivity. The higher it is, the more often areas with known mineralisation are rated above background ground. Model quality is measured on territories that were never used in training.

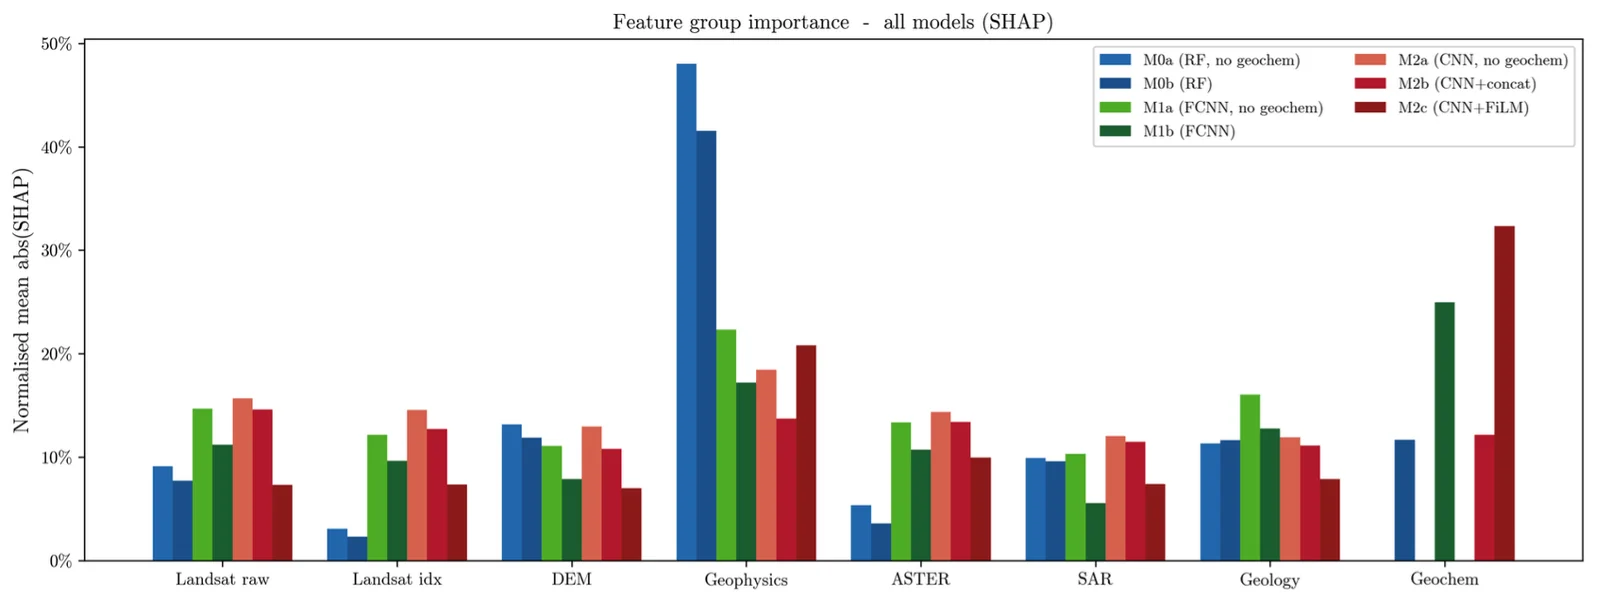
SHAP feature group importance for all models
Explainability (SHAP). Every prediction is broken down by data group: you can see what the model relied on and why it flagged a specific area. Results are presented in a format a geologist can read without any machine-learning background.